Inferential Analysis of Tooth Growth
Alex Fennell
Synopsis
The purpose of this analysis is to examine the Tooth Growth data set and perform some basic inferential statistics on it. The first step of this analysis is an exploratory data analysis. This will be followed by an inferential analysis to test whether supplement delivery type and doseage levels influence odontoblast (tooth) growth in guinea pigs. Code is contained in the appendix following the report.
Exploratory Data Analysis
Reading in the data
The Tooth Growth data set is already available as it is part of the R datasets package. Using the str function, the basic structure of the dataset can be seen.
## 'data.frame':    60 obs. of  3 variables:
##  $ len : num  4.2 11.5 7.3 5.8 6.4 10 11.2 11.2 5.2 7 ...
##  $ supp: Factor w/ 2 levels "OJ","VC": 2 2 2 2 2 2 2 2 2 2 ...
##  $ dose: num  0.5 0.5 0.5 0.5 0.5 0.5 0.5 0.5 0.5 0.5 ...
Summary Statistics
This shows the dataset with 3 variables, len-length of tooth growth, supp-the supplement type, and dose-the numeric does in mg per day. The first thing we can do is change dose to a factor variable and then look at various summary statistics as a function of the two factor variables, dose and supplement type.
## # A tibble: 6 x 7
## # Groups:   supp [2]
##   supp  dose   MEAN    SD   MAX   MIN COUNT
##   <fct> <fct> <dbl> <dbl> <dbl> <dbl> <int>
## 1 OJ    0.5   13.2   4.46  21.5   8.2    10
## 2 OJ    1     22.7   3.91  27.3  14.5    10
## 3 OJ    2     26.1   2.66  30.9  22.4    10
## 4 VC    0.5    7.98  2.75  11.5   4.2    10
## 5 VC    1     16.8   2.52  22.5  13.6    10
## 6 VC    2     26.1   4.80  33.9  18.5    10
This output shows that mean length of odontoblasts increases with dose across both supplement types. The maximum and minimum values also increase as a funciton of increasing dosage. The sample size is the same across all supplement type and dose manipulations. It is difficult to tell if the mean odontoblast length differs across supplement types, so in the next block of code, we will examine this.
## # A tibble: 2 x 5
##   supp   MEAN    SD   MAX   MIN
##   <fct> <dbl> <dbl> <dbl> <dbl>
## 1 OJ     20.7  6.61  30.9   8.2
## 2 VC     17.0  8.27  33.9   4.2
This shows that on average the mean odntoblast length for guinea pigs given orange juice is longer than guinea pigs given ascorbic acid. In addition to this, the maximum and minimum values for guinea pigs in the OJ group are not as extreme as those in the VC group.
Boxplot analysis
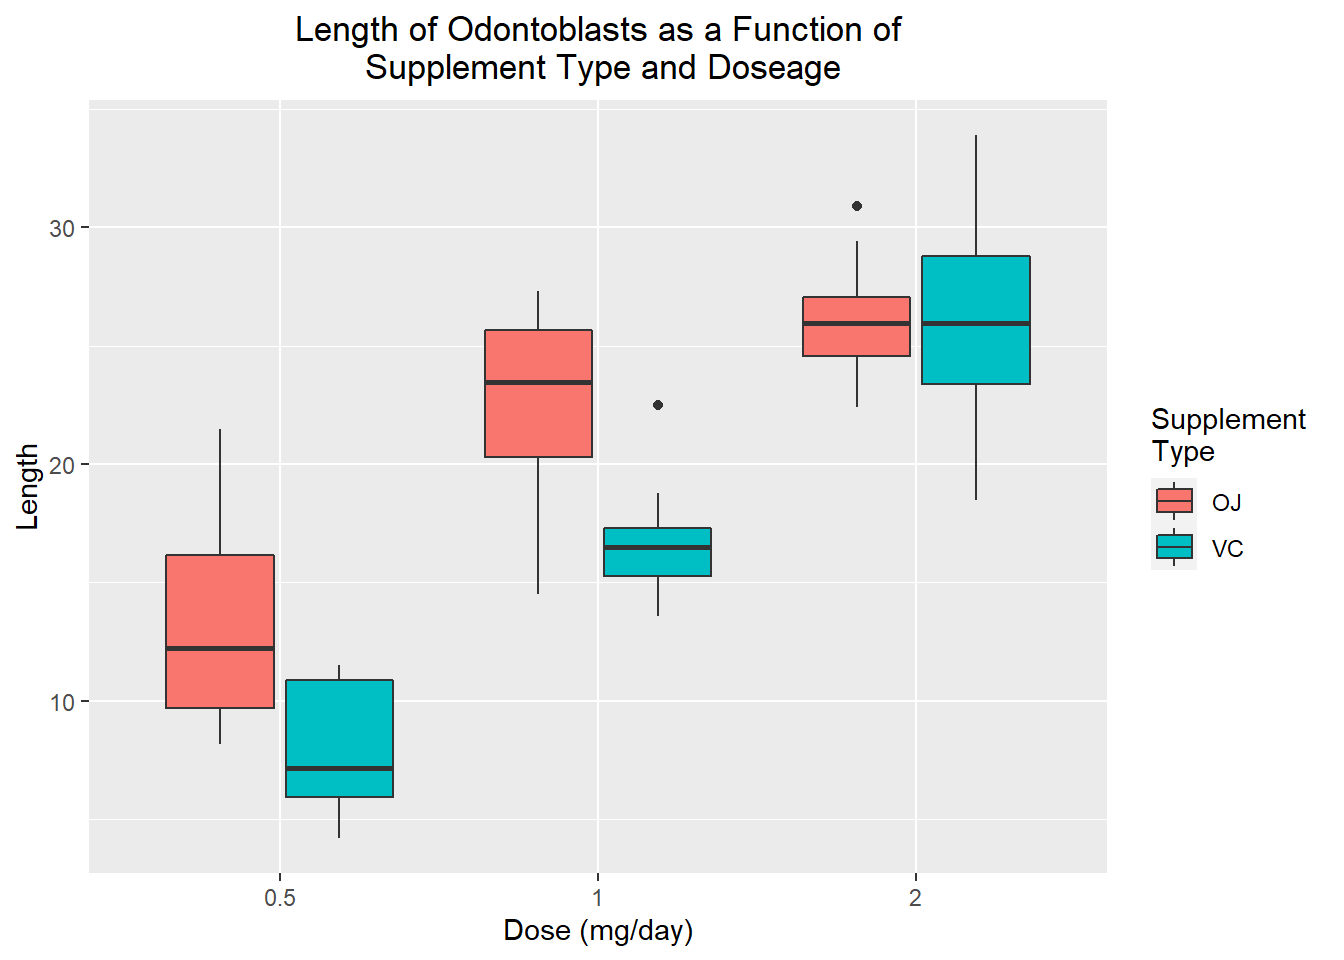
This boxplot better demonstrates the relationship between supplement type, dose, and odontoblast length. In agreement with the previous outputs, it can be seen that odontoblast length increases as the daily doseage increases across both supplement types. The two supplement types do seem to differ in their efficacy at lower doseages. The OJ supplement results in more odontoblast length than the VC Supplement at .5 and 1 mg/day doseges. At the 2mg/day dose, both groups have a similar median value, but the OJ supplement has less spread than the VC supplement. Given these apparent differences, I can now empirically test this using inferential methods
Inferential Analysis
For the inferential analysis, I will be using indpendent samples t-tests. The guinea pigs did not do every treatment condition, so a paired samples t-test would not be appropriate. The mean difference in odontoblast length between supplement type will be examined first. Then I will compare odontoblast length for doseage .5mg vs. 1mg and 1mg vs. 2mg.
Mean Difference by Supplement Type
Based on the EDA from earlier, it appears that OJ results in more tooth growth than VC, thus I will conduct a one-sided t-test. This means that the null hypothesis is that the mean difference in tooth growth between OJ and VC is 0. The alternative hypothesis is that the mean difference in tooth growth between OJ and VC is greater than 0. I am using greater than because I am hypothesizing that OJ results in more tooth growth than VC
##
##  Welch Two Sample t-test
##
## data:  len by supp
## t = 1.9153, df = 55.309, p-value = 0.03032
## alternative hypothesis: true difference in means is greater than 0
## 95 percent confidence interval:
##  0.4682687       Inf
## sample estimates:
## mean in group OJ mean in group VC
##         20.66333         16.96333
Supplement Type Results
The p-value from this one-sided t test is less than .05 which indicates that the null hypothesis that the mean difference in odontoblast growth between the OJ and VC group is equal to 0 is rejected. The output of the t test also provides the lower interval of the confidence interval which does not contain 0 leading to the same conclusion as above. Thus it seems that mean growth of odontoblasts is greater when vitamin C is administered via orange juice rather than ascorbic acid.
Mean Difference by Dose
Since there are 3 levels of administered dose, I will do two one-sided t tests to determine if the length of odontoblasts increases with increasing doses. The null hypotheses for these analyses are that the mean differences in odontoblast length between .5 mg and 1 mg treatment groups (or 1 mg and 2 mg) is equal to zero. The alternative hypotheses are that the average difference in odontoblast growth between the 1 mg treatment and the .5 mg (or 2 mg and 1 mg) is greater than 0. To test this the same t test function with be used but with the alternative argument set to less.
##
##  Welch Two Sample t-test
##
## data:  len[dose == 0.5] and len[dose == 1]
## t = -6.4766, df = 37.986, p-value = 6.342e-08
## alternative hypothesis: true difference in means is less than 0
## 95 percent confidence interval:
##       -Inf -6.753323
## sample estimates:
## mean of x mean of y
##    10.605    19.735
.5 mg vs 1 mg Results
The results from this analysis show that the null hypothesis is rejected as the p-value is (much) less than .05. This is also reflected in the confidence interval which does not contain zero. Thus guinea pigs that receive 1 mg of Vitamin C have greater odontoblast growth than guinea pigs that receive .5 mg of Vitamin C.
##
##  Welch Two Sample t-test
##
## data:  len[dose == 1] and len[dose == 2]
## t = -4.9005, df = 37.101, p-value = 9.532e-06
## alternative hypothesis: true difference in means is less than 0
## 95 percent confidence interval:
##      -Inf -4.17387
## sample estimates:
## mean of x mean of y
##    19.735    26.100
1 mg vs. 2 mg Results
Similar to the previous t test, the null hypothesis is rejected as the p-value is (much) less than .05. Thus guinea pigs that receive 2 mg of Vitamin C have greater odontoblast growth than guinea pigs that receive 1 mg of Vitamin C.
Overall Conclusions
The results from all the t test analyses indicate that both the delivery method and the doseage influence the length of odontoblasts in guinea pigs. Orange juice results in more odontoblast growth than ascorbic acid, and larger doses of Vitamin C result in more odontoblast growth. It should be noted that one-sided t tests were used and unequal variance among the compared groups was assumed. There were also three comparisons done with no multiple correction methods employed which will result in an inflated type I error rate. Future investigations would benefit from delving into the interaction between supplement type and doseage. Based on the exploratory data analysis, it seems that the supplement type had an effect at lower doses, but not at the highest dose.
Appendix
knitr::opts_chunk$set(echo=FALSE)
library(dplyr)
library(ggplot2)
TGdata<-ToothGrowth
str(TGdata)
# Need to change dose column into a factor rather than a numeric variable
TGdata$dose<-as.factor(TGdata$dose)

Summary_TGdata<-TGdata %>%
    group_by(supp,dose)%>%
    summarise(MEAN=mean(len),SD=sd(len),MAX=max(len),MIN=min(len),COUNT=n())
Summary_TGdata
suppcomp<-TGdata %>%
    group_by(supp)%>%
    summarise(MEAN=mean(len),SD=sd(len),MAX=max(len),MIN=min(len))
suppcomp
box1<-ggplot(TGdata,aes(x=dose,y=len,fill=supp))+
    geom_boxplot(notch=FALSE)+
    labs(title="Length of Odontoblasts as a Function of\n Supplement Type and Doseage",
           x="Dose (mg/day)", y="Length",fill="Supplement \nType")+
    theme(plot.title = element_text(hjust = 0.5))

box1
t.test(len~supp,data=TGdata,alternative='greater')
#To test the .5 mg and 1 mg groups
with(TGdata,t.test(len[dose==.5],len[dose==1],alternative='less'))
#To test the 1 mg and 2 mg groups
with(TGdata,t.test(len[dose==1],len[dose==2],alternative='less'))